太陽光発電 情報サービス
- 日本の太陽光発電の課題
- 日射量データベースサービス
- 太陽光発電シミュレーションサービス(Solar-Mesh)
- Solar-Mesh導入実績
- Solar-Mesh申込ご案内
[無料トライアル申込受付中] - Solar-Mesh資料ダウンロード
- 太陽光発電計測
- コラム
気象情報サービス
システム開発サービス
その他
お問い合せ
TEL 03-6873-8081
受付時間 月-金 9:00-17:00
FAX 03-6873-8081
e-mail. orel@orel.co.jp
Solar radiation database
SUNSHINE
Solar radiation database
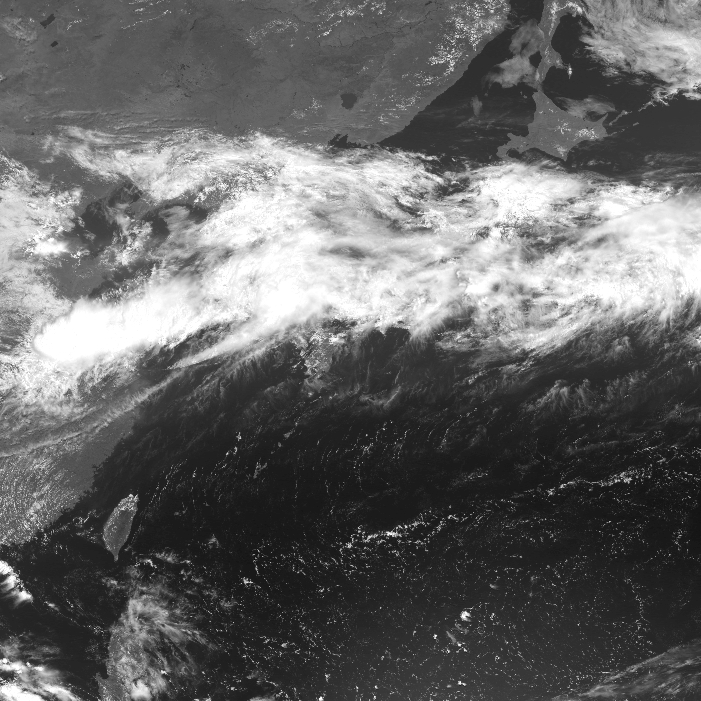
GMS image (courtesy of Meteorological Satellite Center (MSC))
The Solar-Mesh solar radiation database ――
"Solar radiation data as accurate as you need it to be."
Everything you've been looking for in a PV power-generation simulator.
| Features of the OREL solar radiation database | |
 |
Data from meteorological satellites, radar and other sources are analyzed with historical cloud movements taken into account, letting you create simulations for any desired region. Recreates pinpoint climate conditions according to the location of the installation, yielding highly precise simulations. This allows you to present highly reliable information to your customers, and add impact to your sales efforts. With Solar-Mesh, data is presented at a spatial resolution of 5 km. The database is compiled from actual solar radiation data taken at 147,497 sites, obviating any need to perform substitutions using observation points located tens of kilometres away. Solar radiation data is given not only for Japan, but for eastern China, Taiwan, and South Korea, as well as for other Asian countries (longitude 115-150° east to latitude 15-50° north). |
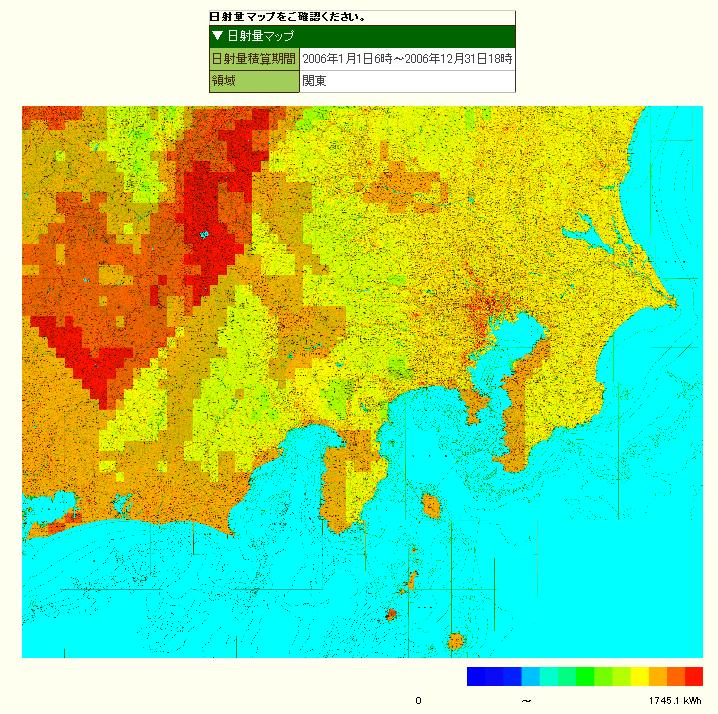 |
Useful for area marketing Learn at a glance where there are regions of high solar radiation, and promote these regions' suitability for PV power generation to win customers. In principle, this database can be used as a valuable resource for potential customers living in these regions, and can increase the demand for PV power generation by making these customers aware of the availability of such power. |
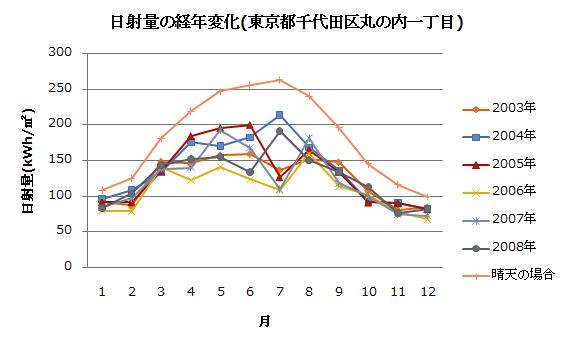 |
Change in solar radiation by month from 2003 to 2008 as measured in the Marunouchi neighborhood of Chiyoda Ward, Tokyo. (2003 to 2008) The graph shows availability (solar radiation) to be lower than on a clear day, with the difference being especially pronounced over the summer months; however, this pattern differs depending on the year. In years like 2004, where there was an unusually dry rainy season (tsuyu), the difference over summer was smaller than in an average year. One reason for the lower availability factor in the summer is that Japan's Pacific side experiences high precipitation in the summer as well as many clear days in the winter. Another reason is that in summer, where the solar radiation level is high in absolute terms, there is a greater loss on cloudier days. |
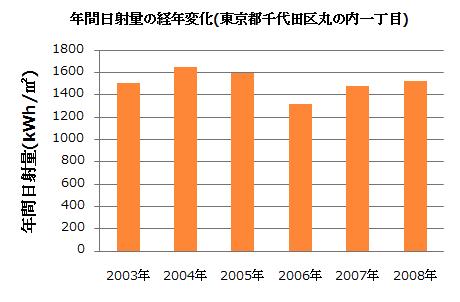 |
Change in solar radiation by year from 2003 to 2008 as measured in the Marunouchi neighborhood of Chiyoda Ward, Tokyo. (2003 to 2008) The chart shows the PV availability factor in terms of hours per year, and also shows the extent of change over successive years. |
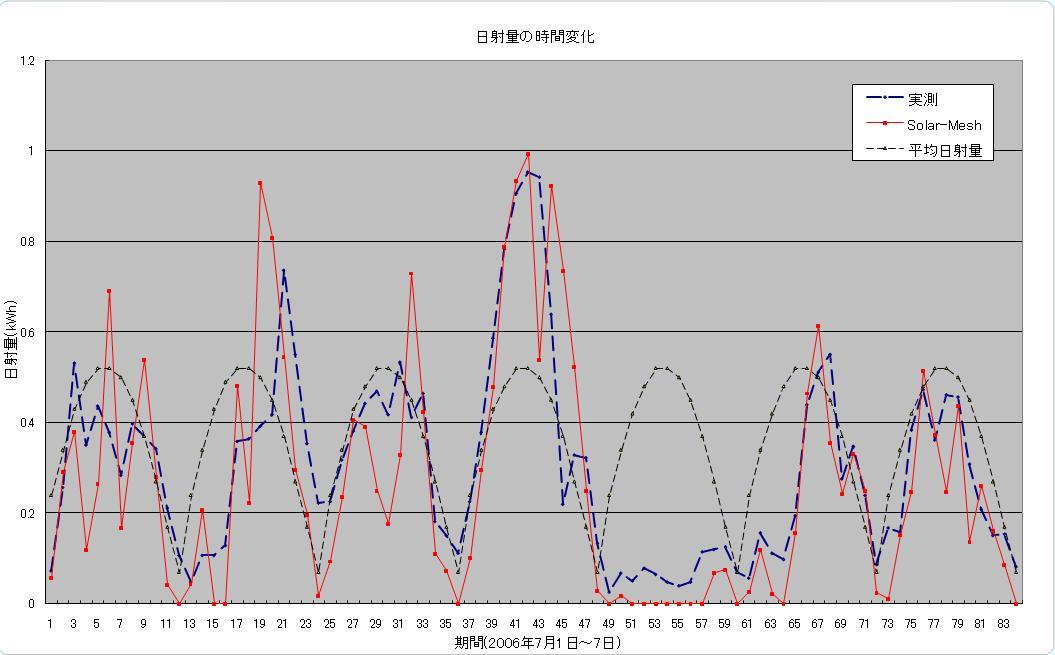 |
A comparison was made between actual solar radiation measurements taken at a climate observation site in Nagoya, radiation levels estimated with Solar-Mesh, and a set of average radiation data often used in conventional simulations. The graph shows data sampled hourly over a period of seven days. Although the radiation levels peaked each day around noon, the graph indicates that the peaks varied in height according to the weather on a given day. Solar-Mesh was able to produce an accurate simulation of this weather-dependent pattern of radiation levels. The average radiation data, on the other hand, reflects average radiation levels over the past 30 years. The averaging makes it impossible for day-to-day changes in the weather to be reflected in the graph. Also, when average radiation levels are used, the data for sites in Toyohashi or Gifu will, for example, be substituted for those of Nagoya, whereas Solar-Mesh allows you to use the data relating to the specific sites. |
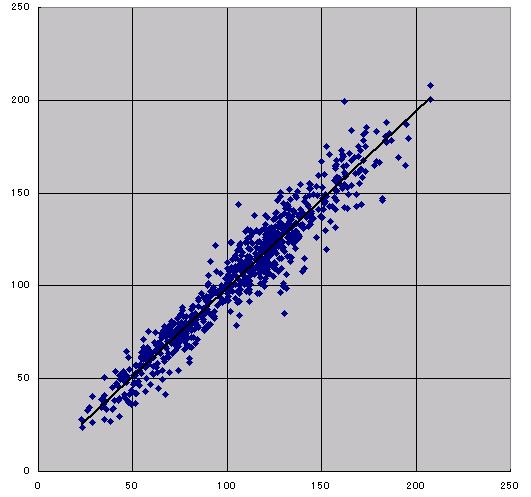 |
Accuracy of a different level Solar-Mesh gives a reflection of the actual weather in specific sites and clearly provides much more accurate radiation level data than do other simulations. Annual cumulative radiation is accurate to an 8% average error. |
| References The algorithm used to estimate solar radiation was developed by the Kosuke Kurokawa Laboratory at the Tokyo University of Agriculture and Technology (TUAT) and by the Research Center for Photovoltaics at the National Institute of Advanced Industrial Science and Technology (AIST). The accuracy of the algorithm was verified as reported in the literature below. The technology underpinning Solar-Mesh has been subjected to an established evaluation procedure supervised by a panel of experts, allowing you to use the solar radiation data with confidence.
|
|